Menu
When code complexity lives in the prompt
You will find the 🇫🇷 French version of this article here
- Our complexity metrics (McCabe, Halstead) assume that a program’s behavior lives in the code. In an application that integrates an LLM, a large part of the logic has moved into the prompt, in natural language, invisible to the analyzers.
- A July 2026 paper measures this across 118 components and shows that McCabe loses all predictive value once you factor out the file’s size.
- What actually predicts maintenance difficulty isn’t size: it’s the number of distinct things a component coordinates. Including in the prompt.
- A surprise: the length of a prompt predicts nothing. What counts is the number of decisions it encodes.
- Counter-intuitive: the more explicit guardrails a prompt sets, the easier it is to maintain.
A few weeks ago, I stumbled on a file I thought I knew. A component of our stack, something that orchestrates a call to an LLM. Nothing spectacular on screen: two or three conditions, a loop, a bit of output parsing. If you ran it through AstMetrics, it would come out green. Low cyclomatic complexity. Nothing to report, move along.
Except this file had a Git history that told a completely different story. Abnormally high activity: repeated bugfixes, month after month, on the same twenty lines.
Static analysis said “this code is simple.” The reality on the ground said exactly the opposite.
And for good reason: this file contained very little code. The bulk of it, what really carried weight, was a prompt. Several dozen lines of natural-language instructions addressed to an LLM.
Concretely, let’s take this simplified code:
PROMPT = """
You are an assistant that triages customer requests.

- If the request concerns an invoice, route it to accounting.
- If the message is ambiguous, ask ONE clarifying question, no more.
- If the customer seems unhappy, adopt an apologetic tone and offer a goodwill gesture.
- If the request is outside your scope, don't answer: return {"escalate": true}.
- Never promise a refund above 50 euros.
... (thirty more lines of rules like this)
"""

def handle_request(message):
    response = llm.complete(system=PROMPT, message=message)
    return json.loads(response)
Two lines of code. A cyclomatic complexity of 1. Green everywhere. And yet every decision this component makes (the conditions, the guardrails, the edge cases) is right there, in the character string the analyzer walks straight through without ever reading it.
So how do you measure the complexity of a software component whose logic lives in a prompt?
The assumption nobody questions
All our quality metrics rest on an idea so obvious we no longer even state it: a program’s behavior is in its code. Take the best known of them all, McCabe’s cyclomatic complexity. It counts the number of paths the code can take, in plain terms its number of ifs, loops and branches. The more there are, the harder the code is deemed to test and to follow. Other families measure other things (the number of operators, the coupling between classes), but they all share the same reflex. They read the source code. And nothing else.
This assumption held true for nearly fifty years, since 1976. When I wrote PhpMetrics, I didn’t question it for a second: there was nothing to question. The code was all there was to measure (including the SQL).
That assumption has just cracked, without many people noticing.
When logic leaves the code
Take an application that relies on an LLM. An agent, an assistant, an orchestration layer, it doesn’t matter. The heart of its behavior isn’t necessarily written in Python or PHP anymore. It’s written in the prompt.
A prompt can contain conditional rules: “if the input is ambiguous, ask for clarification.” It can assign a role, define output constraints, route to one tool or another depending on the situation. That’s conditional logic. It decides what the program does, exactly the way an if in the code would.
But no code metric sees it. Your analyzer passes over $client->messages()->create([...]) and sees a mundane method call. It doesn’t see that the array passed as an argument contains three hundred lines of natural-language instructions encoding half the business behavior.
You are rigorously measuring a half-empty box.
That’s exactly what was happening with our file. Its complexity was real (the Git history wasn’t lying). It was just stored somewhere static analysis doesn’t know to look.
A paper that did the work I’d have liked to do
I came back to this question while reading a July 2026 paper, Rethinking Complexity Metrics for LLM-Integrated Applications: Beyond Source Code, by a team from UNSW and a few other labs.
Because the temptation, faced with a new problem, is to invent metrics on gut feeling. “Let’s count the number of LLM calls, that’s got to mean something.” They did the opposite. They started from twenty-five complexity dimensions already described in the literature, spread across three layers: the code, the prompt, and the interface between the two. From there, fifty-two candidate metrics.
Then they put each metric to this question: does it actually predict real maintenance effort, once you’ve removed the effect of the code’s size?
That business about size is the crux of the matter. We’ve known for a long time that most complexity metrics are, in reality, disguised measures of the file’s size. A large file has high cyclomatic complexity, more bugs, more changes, but is it the complexity that causes this, or just the fact that it’s large? To find out, you have to statistically factor out size and look at what’s left. If nothing is left, the metric was only measuring volume.
Their ground truth, they didn’t invent either. They extracted it from the Git history of eighteen well-known open source repositories (frameworks with tens of thousands of stars). How many times did a component have to be fixed? Across how many different months? By how many contributors? So many objective signals of “this thing was a pain to maintain.”
Very empirical stuff, then: Fifty-two metrics. One hundred and eighteen components. Real maintenance effort as the judge.
What survives, and why
Of the fifty-two candidate metrics, only ten pass the filter. Forty-two collapse as soon as you remove the effect of size. Most of our intuitions about complexity were, deep down, only measuring the file’s size.
Among the survivors, seven are new. Here are the main ones, with their correlation to maintenance effort:
- n_mem_refs (+0.40): the number of memory-related attributes a component manages, the fields called
state,history,context,cache. The more memory channels a component has, the harder it is to follow. - n_llm_calls (+0.38): the number of places in the code that call the LLM. A component with twelve call points doesn’t have the same control loop as one with a single call point, even at equal code size.
- n_attrs (+0.33): the number of instance attributes referenced outside the constructor. An old object-oriented metric, re-adapted.
- inject_surf (+0.27): the number of distinct channels through which the code injects values into the prompts, the
{task}slots, the f-strings, the.format()calls, the template renders. A measure of the coupling between the two layers. - P_dec_ratio (+0.26): the fraction of prompt instructions that are conditional (“if”, “when”, “unless”). In plain terms: cyclomatic density, but computed on the prompt instead of the code.
- n_prompts (+0.23): the number of distinct prompt templates a component manages. Fifteen templates means fifteen behavior contracts to keep consistent with one another.
The number in parentheses is a correlation coefficient with maintenance effort, once code size is factored out. It ranges from 0 (no link) to 1 (perfect link): the higher it is, the more the metric predicts that a component will be a pain to maintain. At
+0.40,n_mem_refsis therefore the strongest signal on the list.
Three classic metrics survive too, but they’re weaker, and one of them holds on by only a residual thread of size.
And here there’s a common thread, a principle that ties all the winners together. They don’t measure volume. They count distinct things. How many memory channels, how many call points, how many templates, how many conditions. Size says nothing; diversity says everything.
The only classic metric that’s truly solid in the batch, in fact, is RFC (the one that counts the number of distinct methods a class can reach). It survives for exactly the same reason: it counts entities, not lines.
And the demonstration I find the most interesting, the one that proves the prompt is a dimension in its own right: the same idea (counting decision branches) gives a correlation of +0.06 in the code, and +0.27 in the prompt. Dead on one side, alive on the other. The logic moved, and the measure finds it exactly where it went to hide.
For the record, the verdict for cyclomatic complexity in this world of LLM calls: once size is factored out, its correlation drops to +0.06. That is to say, nothing. My “green” file from the start of this post wasn’t an accident. It was mathematically predictable.
The surprise: a prompt’s length means nothing
There’s a question I was asking myself before I even opened the paper: what about the prompt’s volume? A two-thousand-word prompt has got to be harder to maintain than a two-hundred-word prompt, right?
No. They tested it, and it doesn’t hold.
The prompt’s volume: correlation +0.07. Volume relative to the word count: -0.02. Halstead-style difficulty applied to the text: -0.03. Vocabulary diversity: -0.22. None of these measures of “weight” survives.
What counts isn’t how many characters a prompt contains, it’s how many distinct decisions it encodes. A long but linear prompt is easy to maintain. A short prompt bristling with nested conditions is a trap.
I find that almost liberating. It breaks an intuition that’s very widespread among people who do prompt engineering, the idea that “long prompt = fragile prompt.” It isn’t length, it’s branching.
The counter-intuitive part that feels good
There’s a detail in the data I read twice to be sure. Some metrics have a negative correlation with maintenance effort. Counting the number of explicit constraints in a prompt (the “you must”, the “never”) gives -0.17. The nesting depth of output schemas: -0.25.
In other words: the more explicit guardrails a prompt sets, the easier it is to maintain. Not harder. The opposite of what intuition whispers.
It makes sense when you think about it. A prompt that clearly says what must never be done, that structures its output with a precise schema, is a prompt whose intentions you understand. A vague prompt, one that leaves everything implicit, is the one you no longer dare touch because you don’t know what will break.
That’s exactly the kind of interesting result: the one that takes a common-sense belief and flips it, data in hand.
What it changes for my own tools
I can’t read this paper without bringing it back to PhpMetrics and AST Metrics.
AST Metrics already dissects the structure of the code. It sees method calls, attributes, branches. What it doesn’t see is the text you pass to an LLM. To it, a three-hundred-line prompt stays a plain character string. An opaque block.
The question this paper poses to me, very concretely: what would an analyzer look like that treats the prompt as a first-class artifact? One that could count, in a Symfony codebase riddled with LLM calls, the n_llm_calls, the inject_surf, the density of conditions in the prompts? Does it even make sense to talk about a “prompt AST”?
I don’t have the answer. But I do know the paper’s corpus is entirely in Python (some LangChain, some MetaGPT, some autogen). None of that exists for the PHP ecosystem. And that’s precisely the kind of gap my tools are used to filling.
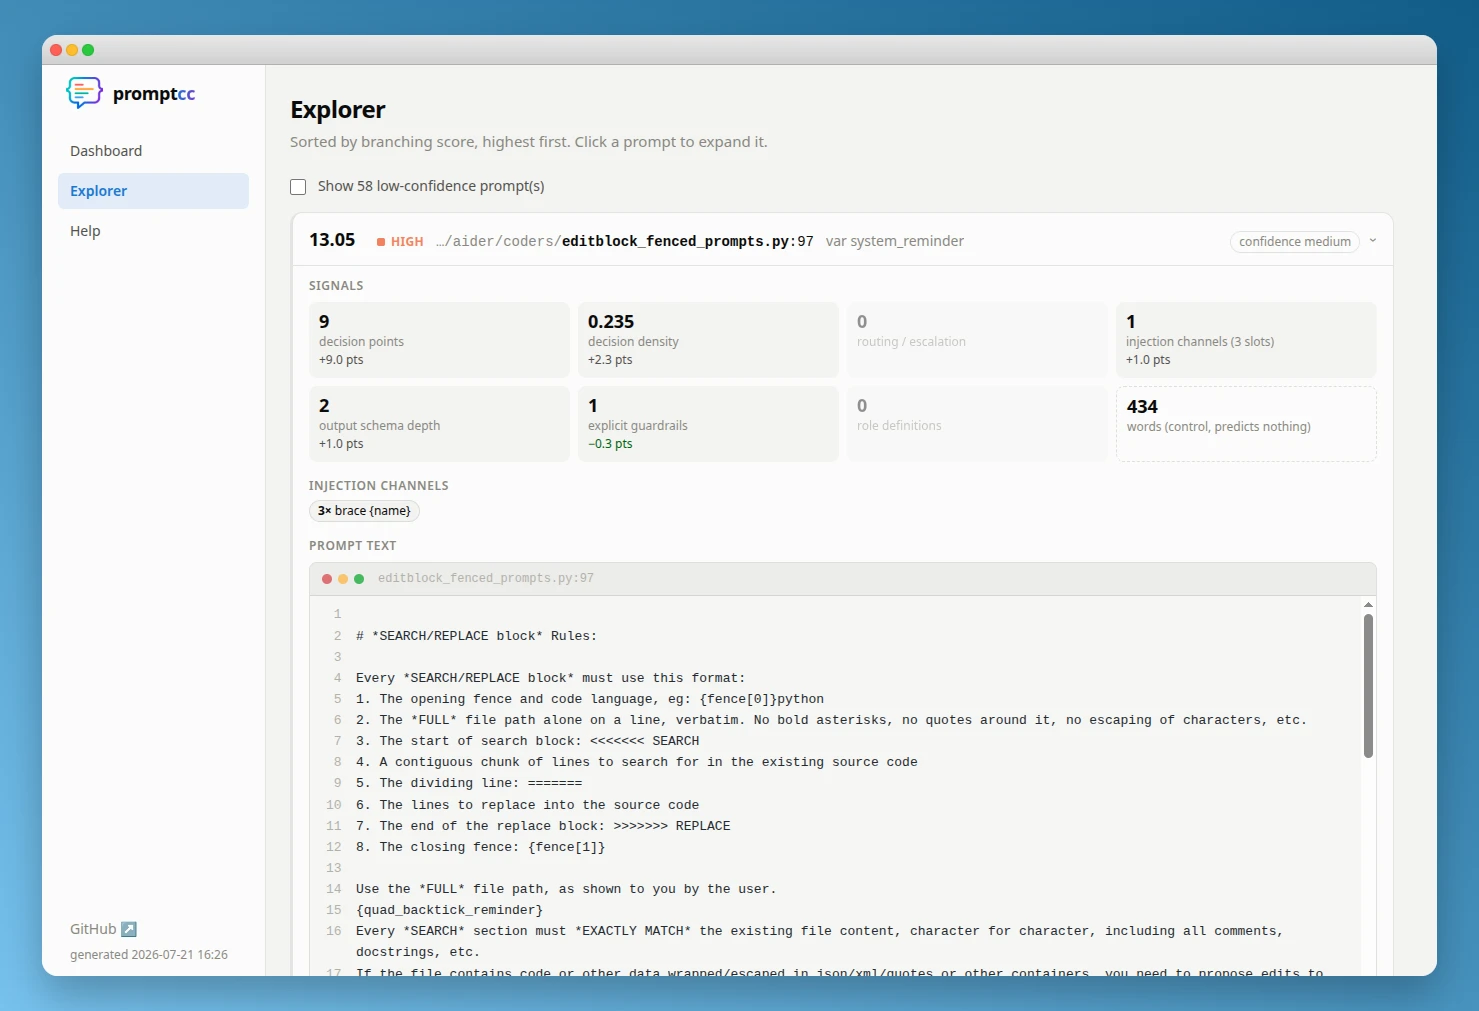
Update: since this post was published, I built that analyzer, it’s called promptcc and it applies the paper’s metrics to the prompts found in source code (Python, TypeScript, JavaScript and PHP). It computes decision density, injection surface, explicit guardrails. And it can fail a CI build when a prompt crosses a complexity threshold.
What the paper doesn’t settle
Careful, we shouldn’t oversell it. The correlations top out at 0.40. That’s significant, that’s real, but we’re talking about a signal, not an iron law. These metrics point toward the components at risk; they don’t diagnose them.
The central formalism (treating each prompt as a contract that states what should come in and what should come out, the way you mathematically prove that a program does what it promises) is elegant on paper. But a prompt remains, by its nature, fuzzy text. Reading it as a formal specification is a seductive theoretical bet, not an established fact.
And one hundred and eighteen components, in a single language, is a start. A first stone, not a truth carved in granite.
What remains is the essential part, and that one won’t move: we changed the material without changing the instrument. We keep measuring the code with rules designed for a world where all the behavior lived in the code. That world no longer quite exists.
I think back to my green file, the one the Git history contradicted. We don’t need to throw out cyclomatic complexity (it still measures very well what it knows how to measure). The problem is that part of the program has left its field of vision. The next generation of quality tools (perhaps the next version of mine) will have to learn to read the layer that took over. That’s what promptcc sets out to do.
I’m left with one question, and I don’t have the answer. If logic keeps migrating toward natural language, what exactly are we measuring when we measure the quality of a piece of software?
Support my work
Open-source sponsoring
PHPMetrics, AST Metrics and the rest are freely available. A little help on GitHub keeps them going.
Sponsor me on GitHub
Audit & Training
Available on Malt
Want an outside look at your codebase? I help engineering teams with architecture, testing and delivery, at the pace of your own projects.
Find me on Malt© Jean-François Lépine, 2010 - 2026 · RSS feed