Menu
How to Audit Go Code with Static Analysis: A Deep Dive into ast-metrics
- Explore the strengths and limits of popular Go static analysis tools like golangci-lint, go vet, and staticcheck.
- Discover ast-metrics, a unique tool focused on architectural insights and unified complexity metrics across multiple languages.
- Learn how ast-metrics helps you visualize code structure, detect coupling, and improve maintainability with fast, CI-friendly analysis.
Static code analysis is one of the most powerful techniques for maintaining code quality at scale. When it comes to Go, there are several excellent tools available, each with their own strengths and trade-offs. In this post, I’ll walk you through the landscape of Go static analysis tools, explain why I built ast-metrics, and show you how to use it effectively in your projects.
Understanding Static Analysis and AST
Before diving into tools, let’s understand what static analysis actually means and how it works.
Static analysis examines source code without executing it, looking for patterns that might indicate bugs, security vulnerabilities, or code quality issues. It’s like having a very thorough code reviewer that never gets tired and can process thousands of lines in seconds.
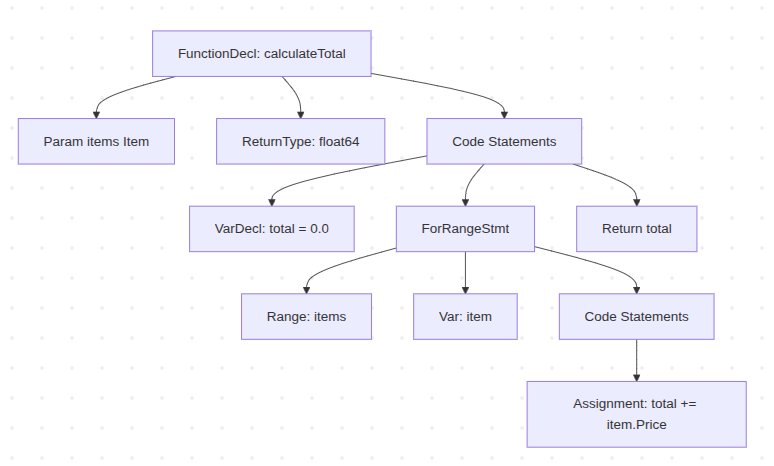
The foundation of static analysis is the Abstract Syntax Tree (AST). When you write Go code like this:
func calculateTotal(items []Item) float64 {
    total := 0.0
    for _, item := range items {
        total += item.Price
    }
    return total
}
The Go compiler first parses this into an AST - a tree structure where each node represents a construct in your code. The func becomes a function node, the for loop becomes a loop node, and so on. Static analyzers traverse this tree, looking for specific patterns and relationships.
This is powerful because it means we can detect not just syntax errors, but semantic issues like:
- Functions that are too complex
- Dependencies that violate architectural rules
- Code that might panic at runtime
- Security vulnerabilities
Analyzing the AST is also a way to get insights into the architecture of the code.
The Go Static Analysis Landscape
Go has a rich ecosystem of static analysis tools, each serving different needs:
golangci-lint
The most popular choice, golangci-lint is actually a meta-linter that runs multiple linters in parallel. It’s fast, configurable, and catches a wide range of issues.
To start using it, you just need to install it and run it:
curl -sSfL https://raw.githubusercontent.com/golangci/golangci-lint/HEAD/install.sh | sh -s -- -b $(go env GOPATH)/bin v2.4.0
golangci-lint run
Then you get a report like this:
This tool is really useful for catching bugs and security vulnerabilities. But it doesn’t provide any architectural insights.
Strengths:
- Comprehensive coverage with 50+ linters
- Excellent performance through parallel execution
- Great CI integration
- Active community and regular updates
Limitations:
- Some linters produce overlapping warnings
- Configuration can be complex for large teams
- Focuses mainly on code style and basic quality issues
go vet
Built into the Go toolchain, go vet catches common mistakes that the compiler doesn’t catch.
You have nothing to do to use it, it’s built into the Go toolchain. Just run it:
go vet ./...
Gives something like this:
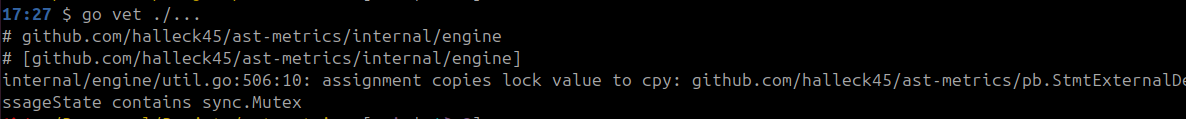
Having a tool built into the language is a big plus. It’s really something super in Golang. But it’s still very basic (useful!), and very focused on instructions, not on architecture.
Strengths:
- Always up-to-date with Go releases
- Zero configuration required
- Very fast execution
- Catches subtle bugs
Limitations:
- Limited scope compared to third-party tools
- No architectural analysis
- No complexity metrics
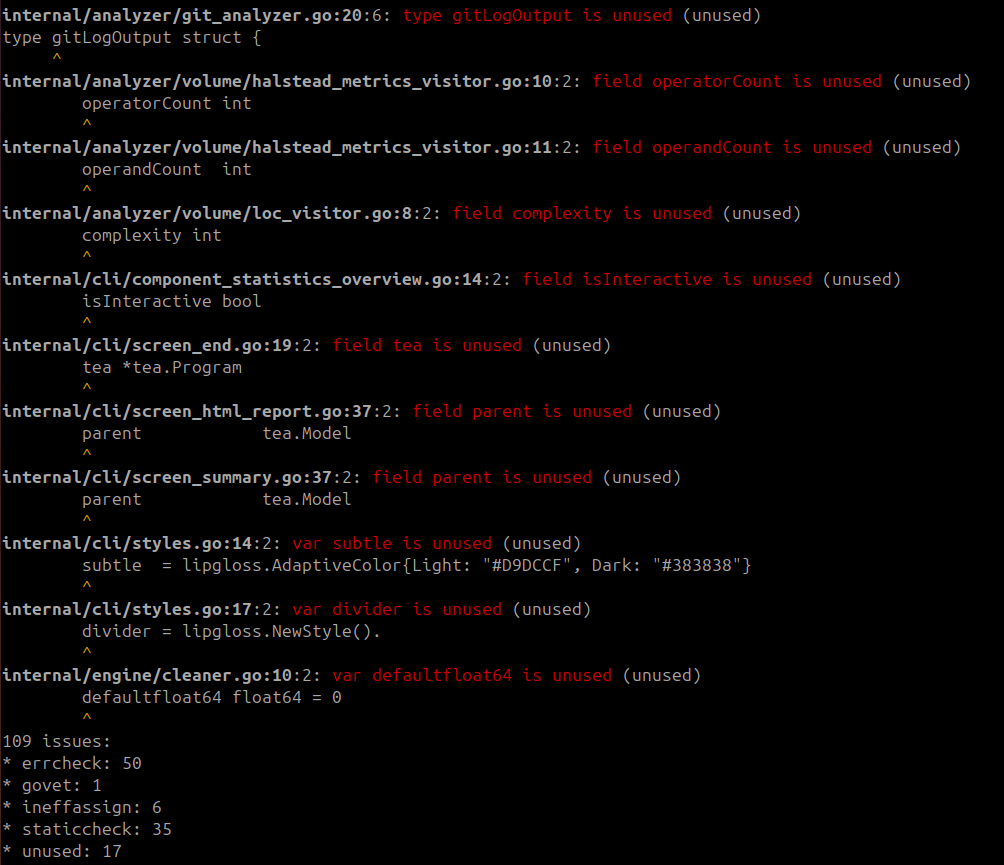
staticcheck
A sophisticated linter that goes beyond basic checks to find bugs and performance issues.
It detects dead code, uninitialized variables, and more.
staticcheck ./...
After running it, you get a report like this:
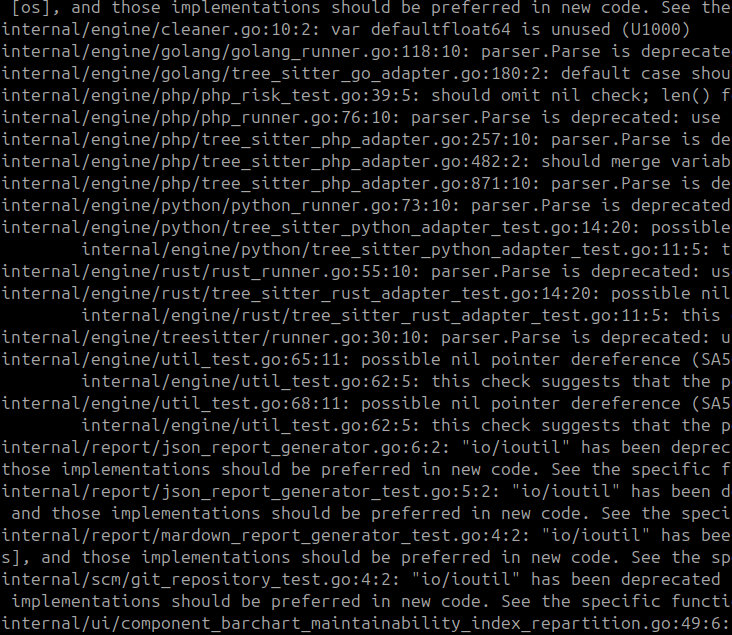
This tool is really useful for finding bugs and performance issues. But it doesn’t provide any architectural insights. But, just like the others, it also doesn’t help you understand the architecture of your codebase.
Strengths:
- Excellent at finding real bugs
- Good performance
- Clear, actionable error messages
- Catches issues other tools miss
Limitations:
- Focuses on correctness rather than architecture
- No complexity or maintainability metrics
- Limited architectural analysis
SonarQube
SonarQube is more a debt detection tool than a static analysis tool, even if it can be used for static analysis.
It’s very useful for detecting debt and code smells, and give insights into the codebase.
But it’s very heavy and resource-intensive, and requires a significant infrastructure.
I’m not the best person to talk about it, as I haven’t used it in years.
Strengths:
- Very comprehensive analysis
- Great reporting and dashboards
- Supports many languages
- Good for enterprise environments
Limitations:
- Heavy and resource-intensive
- Complex setup and maintenance
- Can be overkill for smaller projects
- Requires significant infrastructure
Why I Built ast-metrics
I code since more than 20 years, and I noticed that static analysis tools were often limited. In general, I notice that:
-
Architectural analysis was limited: most tools focus on individual files or functions, but don’t help you understand how your code is structured at a higher level.
-
Complexity metrics were scattered: you could get cyclomatic complexity from one tool, coupling from another, but there was no unified view.
-
CI integration was cumbersome: setting up comprehensive analysis in CI often meant running multiple tools and combining their outputs.
-
Reports were not actionable: many tools produce lists of issues, but don’t help you understand the bigger picture or prioritize fixes.
I have a good experience with static analysis tools. In 2013, I created PhpMetrics, a static analysis tool for PHP. I immediately imagined something very different, not focused on syntax or language sugar, but rather on architecture and code quality in general. A tool to give feedback, and not to decide for the developer.
It’s a tool that is quite unique in its approach, and I haven’t found anything like it in static analysis tools for other languages.
Since then, I have had the opportunity to work on more and more complex projects, with more and more teams. I noticed that static analysis tools were often limited, and that teams didn’t know how to use them. It’s necessary to configure them for each language, integrate them into the CI, etc.
I have therefore decided to create ast-metrics, a static analysis tool agnostic of the programming language, and above all which gives a view of the code and its architecture. Not necessarily a tool to check such or such instruction, but rather something that tells you if your packages are too coupled, if your methods are too complex, if your data structures are too large, etc.
ast-metrics was born from the need for a tool that provides architectural insights, complexity metrics, and activity analysis in a single, fast binary that’s easy to integrate into any workflow, for any language.
Key Features of ast-metrics
Multi-language Support
While built in Go, ast-metrics supports multiple languages (Go, Python, Rust, PHP) with more coming. This makes it valuable for polyglot projects.
Architectural Analysis
The tool’s most distinctive feature is its ability to detect “communities” - clusters of tightly coupled components in your codebase. This helps you understand your architecture and identify refactoring opportunities.
Comprehensive Metrics
ast-metrics calculates over 20 different metrics including:
- Cyclomatic complexity
- Maintainability index, Bugs probability
- Coupling (afferent and efferent)
- Lines of code (physical and logical)
- Activity metrics (commits, bus factor)
- Lack of cohesion of methods (LCOM)
and more.
Fast and Dependency-free
A single binary with no external dependencies, making it perfect for CI/CD pipelines.
I think we can make it much more performant, but it’s a project that is in constant development, and is constantly evolving.
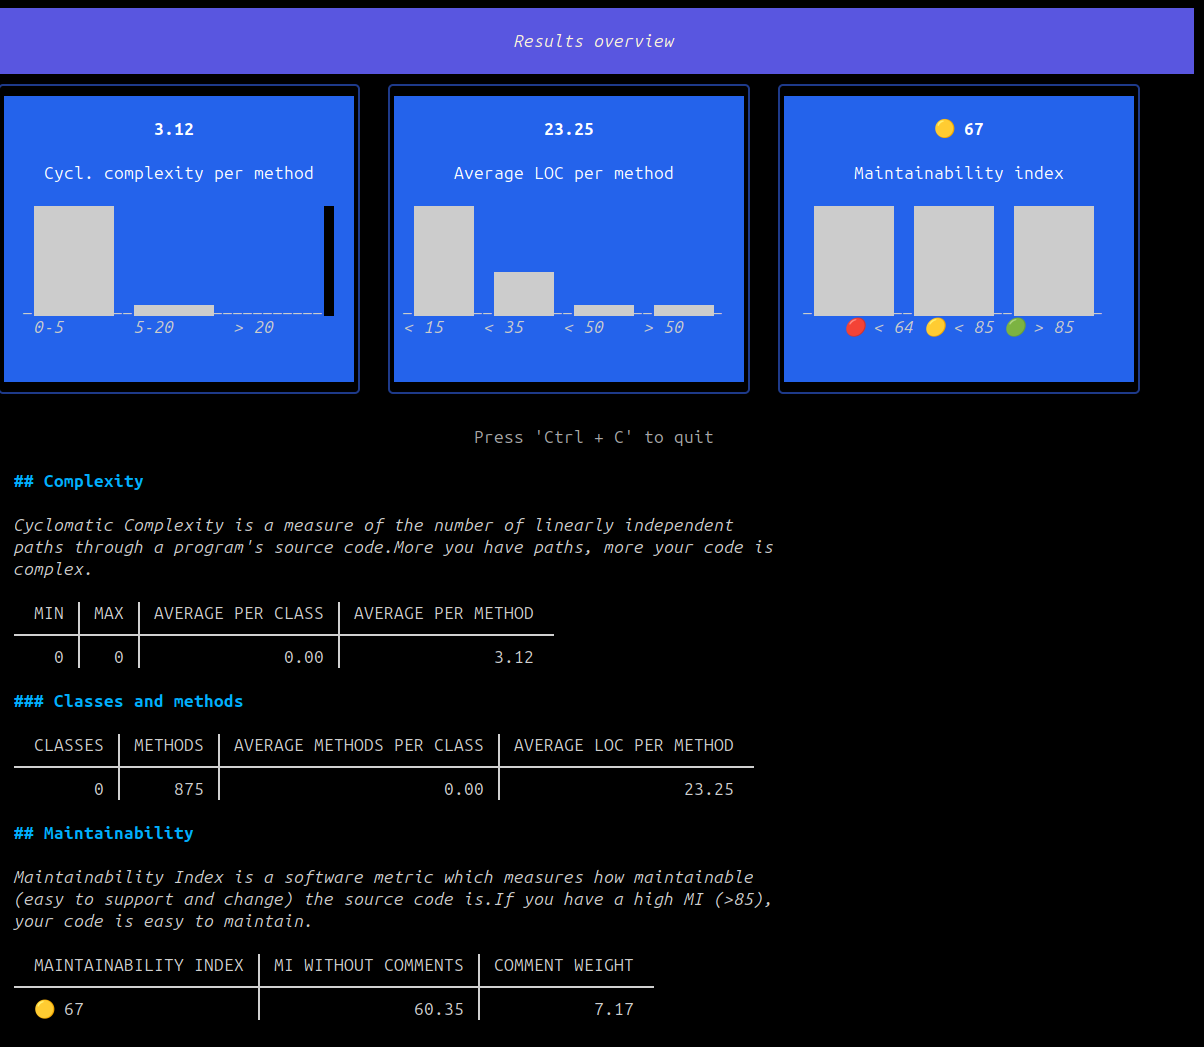
A CLI app, with HTML reports
It’s not just a tool that throws a bunch of numbers at you. You can actually navigate through your code metrics right in your terminal (thanks to lipgloss and bubbletea!)
Getting Started with ast-metrics
Installation
The easiest way to install ast-metrics is using the provided script:
curl -s https://raw.githubusercontent.com/Halleck45/ast-metrics/main/scripts/download.sh | bash
This downloads the appropriate binary for your platform. For manual installation, check the official documentation.
Basic Analysis
To analyze your Go project:
ast-metrics analyze --report-html=./report /path/to/your/code
This generates an HTML report in the ./report directory. The report includes multiple views:
- Overview: High-level metrics and trends
- Risks: Potential issues and code smells
- Explorer: Detailed file-by-file analysis
- Architecture: Architectural insights
- Compare: Branch comparison (if using Git, and if you used the
--compare-withoption)
## Exploring the report
I invite you to explore the Architecture page, which gives you an overview of the architecture of your code.
For example, here is the architecture report for the ast-metrics project:
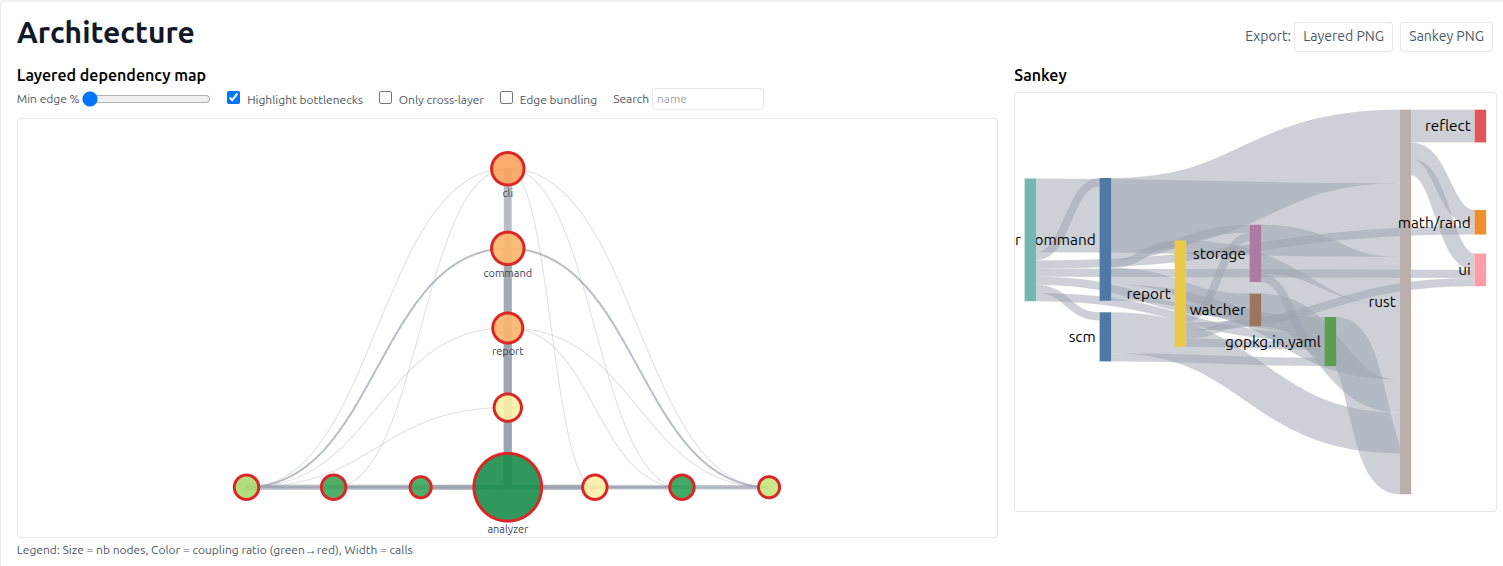
In the top of the chart, you have the entrypoint of your code (the “highest layers”). And at the bottom, you have the “lowest layers” of the project (the package and components used by the entrypoints).
You can also explore the “purity” of your packages. A package is pure if it does not depend on any other package.
I’m currently refining the algorithms, but I already find the results quite promising. The next step for me is to keep making things as clear as possible. But it’s a good start!
Configuration with Rulesets
Even if it’s not the main objective of ast-metrics, you can use it as a linter for yours projects.
ast-metrics uses a ruleset-based configuration system. Start by initializing a configuration file:
ast-metrics init
This creates a .ast-metrics.yaml file. Then add rulesets based on your needs:
# List available rulesets
ast-metrics ruleset list

# Add specific rulesets
ast-metrics ruleset add architecture
ast-metrics ruleset add volume
ast-metrics ruleset add complexity
ast-metrics ruleset add golang
Each ruleset contains related rules. For example, the architecture ruleset includes:
- Coupling constraints
- Circular dependency detection
- Maintainability thresholds
- God class detection
Understanding Rulesets
Let’s look at what each ruleset provides:
Architecture Ruleset
requirements:
  rules:
    architecture:
      coupling:
        forbidden:
          - from: Controller
            to: Repository
          - from: Repository
            to: Service
      max_afferent_coupling: 10
      max_efferent_coupling: 10
      min_maintainability: 70
This enforces architectural constraints like preventing controllers from directly accessing repositories.
Volume Ruleset
    volume:
      max_loc: 1000
      max_logical_loc: 600
      max_loc_by_method: 30
      max_logical_loc_by_method: 20
Controls file and method size limits.
Golang Ruleset
    golang:
      no_package_name_in_method: true
      max_nesting: 4
      max_file_size: 1000
      max_files_per_package: 50
      slice_prealloc: true
      context_missing: true
      context_ignored: true
Enforces Go-specific best practices.
Future Rulesets
I try to add new ruleset, based on my experience and my ideas.
Feel free to contribute if you have ideas ❤️!
Linting Your Code
Once you have rules configured, you can lint your code:
ast-metrics lint
This will check your code against all enabled rules and report violations. The output is designed to be actionable, with clear explanations of what’s wrong and how to fix it.
CI Integration
ast-metrics provides a dedicated CI command that runs linting and generates all reports:
ast-metrics ci
This command:
- Runs the linter first
- Generates HTML, Markdown, JSON, OpenMetrics, and SARIF reports
- Exits with non-zero status if violations are found
- Still produces reports even if violations exist
GitHub Actions Integration
**For GitHub Actions, there’s a dedicated action:
name: "AST Metrics"
on: [push]
jobs:
  build:
    runs-on: ubuntu-latest
    steps:
        - uses: halleck45/action-ast-metrics@v1
This automatically analyzes your code on every push and can be configured to fail the build on violations.
Exploring Architecture with Communities
One of ast-metrics’ most powerful features is its community detection algorithm. This analyzes your code’s dependency graph to identify clusters of tightly coupled components.
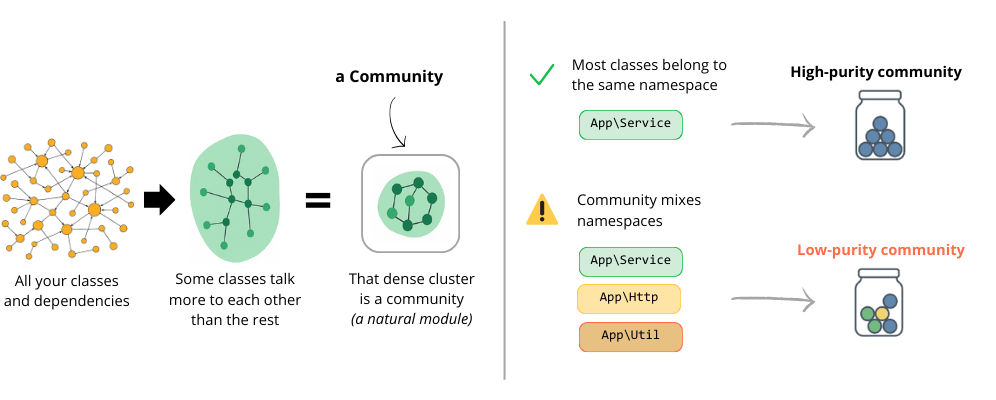
How Community Detection Works
The algorithm uses label propagation to group related components. It starts by assigning each component to its own community, then iteratively moves components to the community that most of their neighbors belong to.
This reveals the natural boundaries in your codebase - areas that are tightly coupled internally but loosely coupled to the rest of the system.
Reading the Communities Report
The communities page in the HTML report shows:
- Community graph: The relations between your packages.
- Community Details: Size, coupling ratios, and key components for each community
- Architectural Suggestions: Recommendations for refactoring based on the analysis
For example, if you see a community with high outbound coupling (>0.7), the tool might suggest introducing a facade pattern. If a community is very large (>50 components) with low purity (<0.6), it might suggest splitting the module.
Using Communities for Refactoring
Communities help you answer questions like:
- Which parts of my code are too tightly coupled?
- Where should I introduce interfaces to reduce coupling?
- What are the natural boundaries for microservices?
- Which components are architectural bottlenecks?
Advanced Usage
Branch Comparison
Compare your current branch with another branch or commit:
ast-metrics analyze --compare-with=main .
This shows how metrics have changed between branches, helping you understand the impact of recent changes.
Custom Exclusions
Exclude files or directories from analysis:
ast-metrics analyze --exclude=".*_test.go" --exclude="vendor/" .
Multiple Report Formats
Generate reports in different formats:
ast-metrics analyze \
  --report-html=./html-report \
  --report-json=./metrics.json \
  --report-sarif=./results.sarif \
  --report-openmetrics=./metrics.txt \
  .
This is particularly useful for CI pipelines where different tools consume different formats. If you
don’t know what is the correct format for you, use the --ci option: it will generate all the reports once.
Current Limitations and Future Directions
ast-metrics is actively developed, but there are some current limitations:
Language Support
While supporting Go, Python, Rust, and PHP, some languages have more complete support than others. TypeScript, Java, and C++ support is planned, and I hope to support more languages in the future.
Rule Customization
While the ruleset system is flexible, some advanced customization scenarios might require code changes rather than configuration.
IDE Integration
Currently, ast-metrics is primarily a command-line tool. IDE integration would make it more accessible for day-to-day development. I think that a VsCode extension would be a good idea.
Performance on Very Large Codebases
While fast, very large codebases (millions of lines) might require optimization for memory usage. For example, analyzing 2 millions of lines of code takes a around 30 seconds on my computer. It can be improved.
Best Practices for Go Static Analysis
Based on my experience with ast-metrics and other tools, here are some recommendations:
Start Simple
Begin with basic rules and gradually add more sophisticated ones as your team gets comfortable.
Focus on Architecture
Don’t just look at individual files - understand how your components interact. This is where ast-metrics really shines.
Use Multiple Tools
ast-metrics complements rather than replaces other tools. Use golangci-lint for style issues and ast-metrics for architectural analysis.
Integrate Early
Set up static analysis in your CI pipeline from day one. It’s much easier than retrofitting it later.
Review Regularly
Static analysis is not a silver bullet. Regular code reviews and architectural discussions are still essential.
My final thoughts
Static analysis is a crucial part of maintaining code quality, especially as your codebase grows. While there are many excellent tools available, ast-metrics fills an important gap by providing architectural insights and comprehensive metrics in a single, easy-to-use tool.
The key is to start with basic analysis and gradually incorporate more sophisticated rules as your team’s needs evolve. The communities feature alone can provide valuable insights into your code’s structure and help guide refactoring efforts.
Whether you’re working on a small Go service or a large polyglot system, static analysis tools like ast-metrics can help you write better, more maintainable code. The investment in setting up these tools pays dividends in reduced bugs, easier refactoring, and better architectural decisions.
Give ast-metrics a try on your next project, and let me know what you think. The project is open source and welcomes contributions - after all, the best tools are built by the community that uses them.
ast-metrics is available on GitHub and documented. For questions or contributions, feel free to open an issue or start a discussion.
💡 Ces sujets vous parlent ?
Vous voulez améliorer la qualité de vos projets sans ralentir la livraison.
J'accompagne les équipes PHP avec des audits ciblés et des formations concrètes. Architecture, tests, industrialisation et pratiques d'équipe, chaque intervention est adaptée à votre contexte.
© Jean-François Lépine, 2010 - 2026