Menu
Yet another static analysis tool. Yes, but better!
You will find the 🇫🇷 French version of this article here
- AST Metrics is a fast, simple, language-agnostic static analysis tool written in Go, designed to analyze millions of lines of code in seconds.
- It produces clear, accessible metrics like complexity and maintainability, with easy installation and no dependencies.
- Integrate it into your CI pipeline to enforce code quality thresholds and architectural rules automatically.
- Try it now to catch code issues early, improve maintainability, and help shape the future of this promising open-source project!
10 years after starting the development of PHP Metrics, I think it’s time to start something new, more modern… and more ambitious.
AST Metrics
AST Metrics is a tool, written in Go, for static code analysis. It is a performant, simple, language-agnostic tool.
Why Go? First and foremost for performance. Where most code analyzers take several minutes, AST Metrics only takes a few seconds to parse several million lines of code and tens of thousands of commits.
And then for fun: I’ve wanted to learn Go for a long time, and I thought this was a good opportunity.
Why a new tool?
Code analysis involves traversing the source code, transforming it into an abstract syntax tree (AST), and analyzing this tree to extract metrics.
Among the most common metrics are:
- code complexity (the number of decision points);
- maintainability index;
- coupling between classes;
- etc.
My vision is to make these metrics readable and understandable to as many people as possible, and to make them accessible to all developers.
I want to produce something that is easy to use and attractive, performant, and easy to install.
Think of AST Metrics as a linter on the architecture of your code, which allows you to detect quality problems before they become problems.
How does it work?
Installation is quite simple. You just need to fetch a binary from Github. No dependencies, no complicated installation, no configuration file to edit.
In the command line, run the following command:
curl -s https://raw.githubusercontent.com/Halleck45/ast-metrics/main/scripts/download.sh|bash
Be careful, as with any command found on the Internet, read the script before running it.
If you prefer a manual installation, everything is explained here.
Then run the following command to analyze, for example, your project /www/myproject:
ast-metrics analyze /www/myproject --non-interactive --report-html=/tmp/report
An HTML report will be generated in the file /tmp/report/index.html, which you can open in your browser.
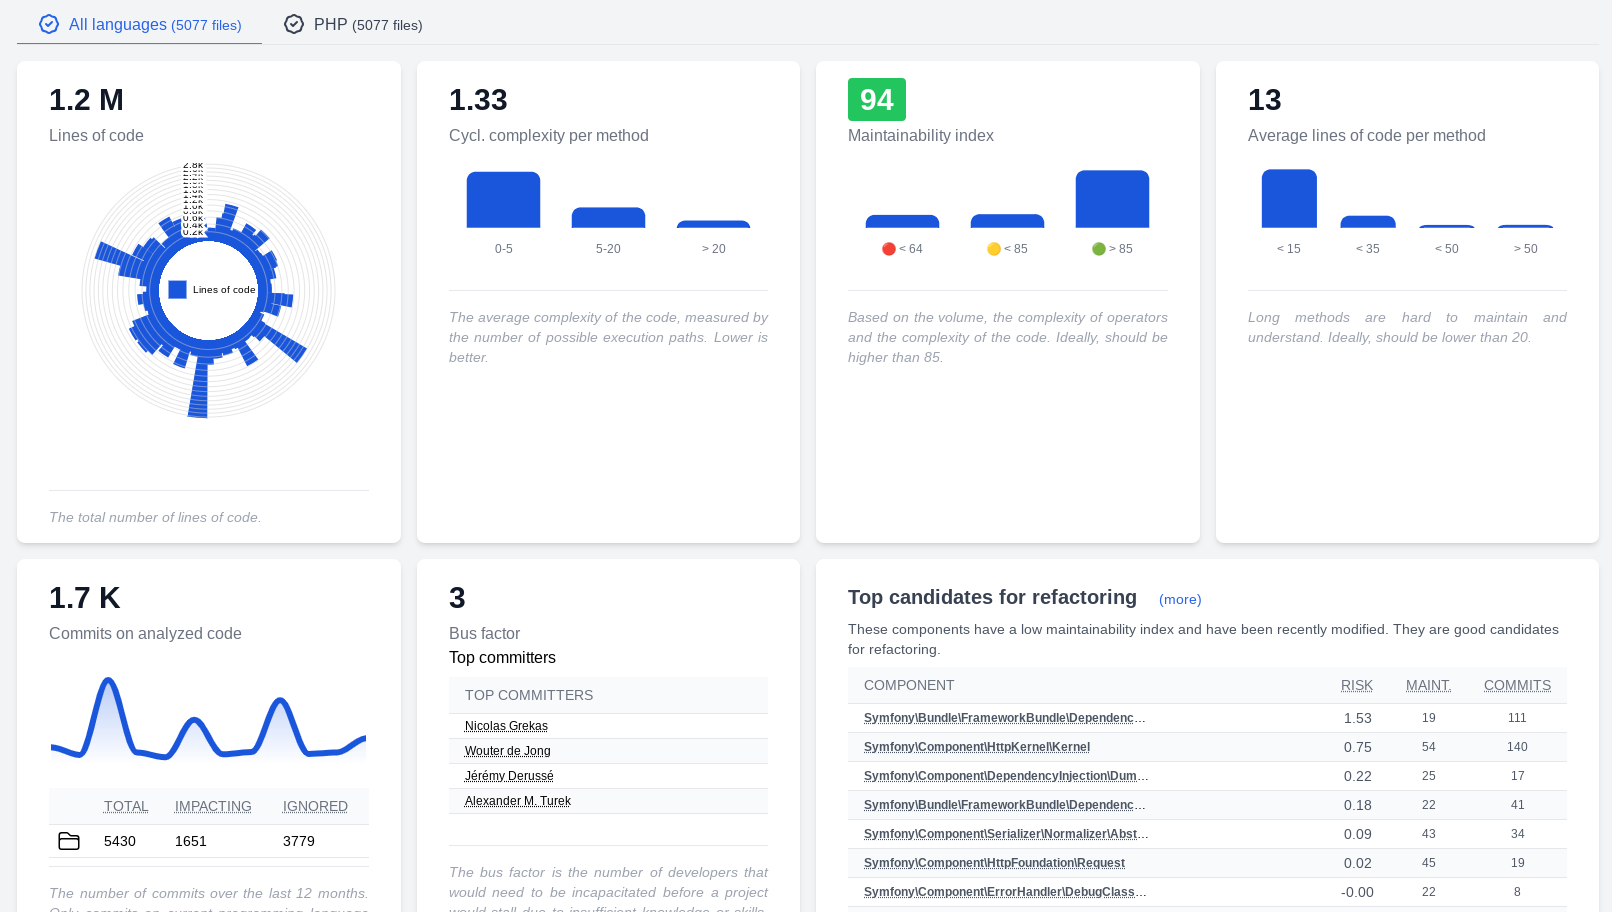
Note that I used the --non-interactive option for simplicity in this blog post. If you don’t add it, a CLI application will allow you to navigate among the different metrics.
Lint your code
Of course, AST Metrics goes further. You can, for example, ensure that your code does not exceed certain thresholds.
Generate a .ast-metrics.yaml configuration file in your project by running the following command:
ast-metrics init
And edit it to add your thresholds:
sources:
  - /www/myproject

exclude:
  - /vendor/
  - /node_modules/

reports:
  html: ./build/report
  markdown: ./build/report.md

requirements:
  rules:
    fail_on_error: true

    maintainability:
      min: 85
From now on, the analysis will fail if the maintainability of your code is less than 85.
ast-metrics analyze --non-interactive
You can also control cyclomatic complexity, coupling between classes, etc.
For example, to forbid too complex code:
requirements:
  rules:
    fail_on_error: true
    cyclomatic_complexity:
      max: 10
Or to check the coupling between classes:
requirements:
  rules:
    fail_on_error: true
    coupling:
      forbidden:
        - from: "Controller"
          to: "Repository"
Now, if a controller depends on a repository, the analysis will fail (note that these are regular expressions that are used here).
This is very useful, for example, if you want to ensure that your code respects the architecture principles you have defined with your colleagues.
And continuous integration?
AST Metrics is designed to be used in a CI/CD pipeline.
For example, for Github, you just need to add the Github action that is already ready to use for you:
In the file .github/workflows/ast-metrics.yml:
name: AST Metrics
on: [push]
jobs:
  build:
    runs-on: ubuntu-latest
    steps:
        - name: AST Metrics
          uses: halleck45/action-ast-metrics@v1.0.2
And that’s it, with each push, your code will be analyzed, and you will receive a complete report. If you have defined thresholds, the CI will fail if these thresholds are not met.
For example, here is a report generated by the CI in Github:
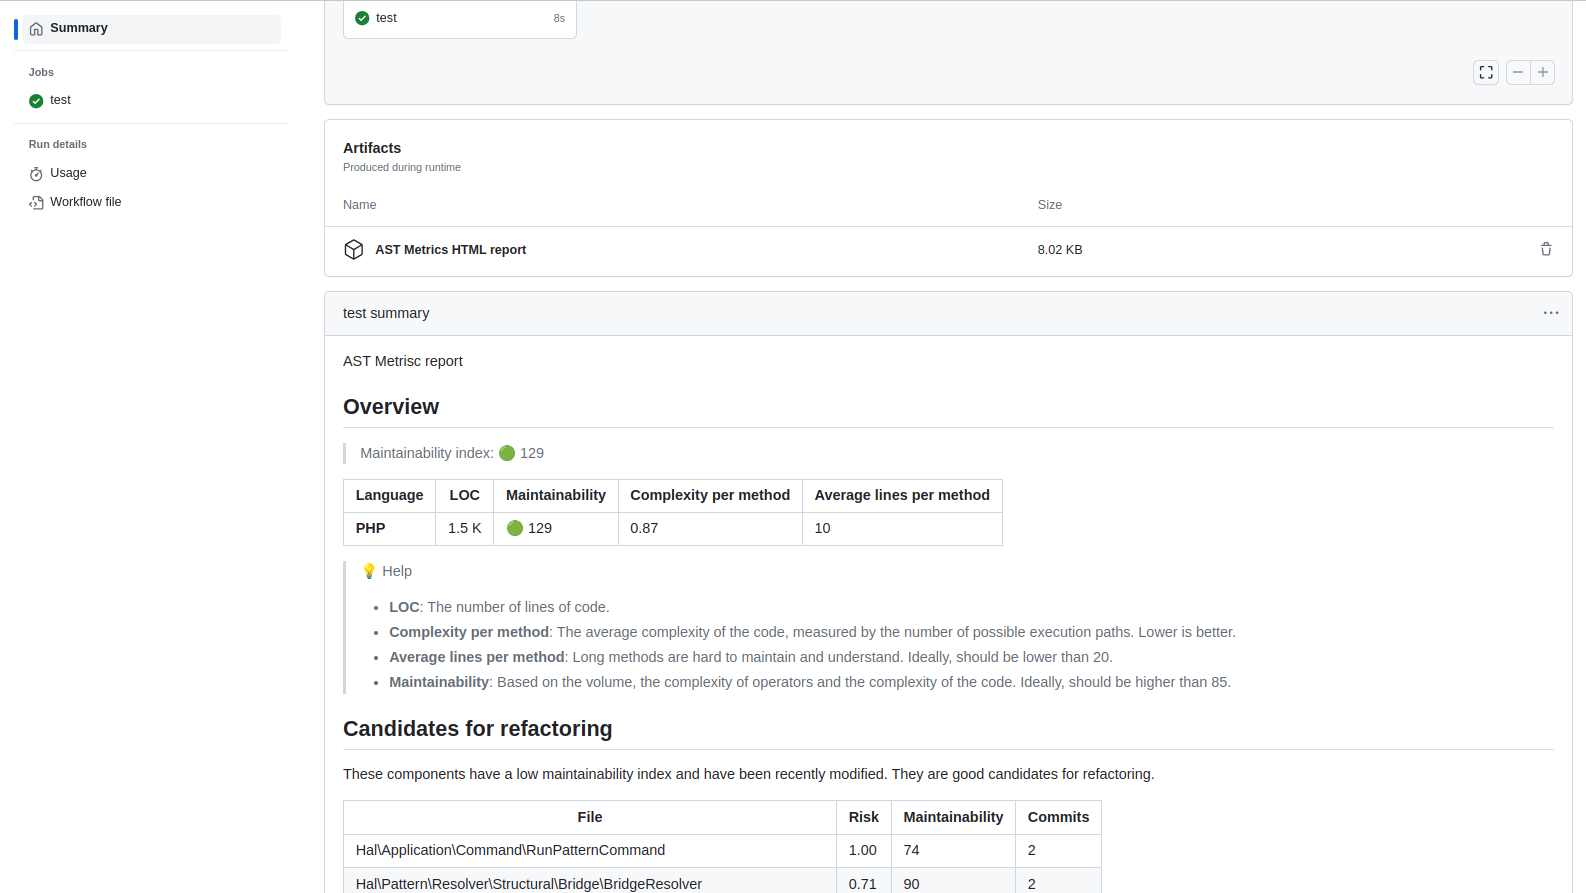
To go further, do not hesitate to consult the documentation.
And what’s next?
The project is still in its infancy, and experimental. But promising, I think!
The next step is to better support other programming languages, and, in an ideal world, to add trends. There is also a lot of work to be done on error handling, improving the tool…
In the long run, I would like to add two AIs: a generative AI, to give refactoring advice, and a predictive AI, to predict bugs and risky commits.
I would like this project to grow and offer the maximum number of features and services. And for that, I need help!
If you want to help, the best thing to do is to test the tool and talk about it around you. Thank you! And don’t hesitate to tell me what you think, if you find bugs, or even to encourage me by offering me a ☕ coffee. It’s always nice to have feedback, whatever it is.
OctoFirst
See where your team gets stuck
The project I'm building right now. Your pull requests already say a lot: where the team gets stuck, and how work splits between bugs, features and refactoring. OctoFirst turns it into clear signals, with no reporting to do by hand.
Take a look, it's freeAudit & Training
Available on Malt
Want an outside look at your codebase? I help engineering teams with architecture, testing and delivery, at the pace of your own projects.
Find me on Malt© Jean-François Lépine, 2010 - 2026 · RSS feed